My NASA Data Capstone Project
Overview
During the week of
The My NASA Data Capstone Project is a post-workshop activity designed for the Tidewater Community College students in ITE 152 – Digital Literacy and Computer Applications, AST 236 – Specialized Computer Applications, and ITE 115 – Introduction to Computer Applications and Concepts.
Topic
Earth’s Geosphere and Climate Change
Lesson Timeframe
This capstone project needs to be introduced 4 weeks before the due date.
STEM Takes Flight Workshop Resources Used
- For the Excel PivotTables data:
- Visit My NASA Data – Geosphere Data at https://mynasadata.larc.nasa.gov/
- For poster ideas and content:
- Visit the NASA Global Climate Change website at https://climate.nasa.gov/
- Visit the World Wildlife Foundation at https://www.worldwildlife.org/threats/effects-of-climate-change
- Use your favorite search engine. (ex. Google, Microsoft Bing, DuckDuckGo, Ask.com, Yahoo…), search images using the keywords Climate Change Awareness Posters
Instructor Level
The instructor must have an intermediate skill level using:
- Microsoft Excel 365
- Microsoft Word 365
- Microsoft PowerPoint 365
- Google Chrome, Mozilla Firefox, or Safari web browser
Student Level
Students must have an introductory skill level using:
- Microsoft Excel 365
- Microsoft Word 365
- Microsoft PowerPoint 365
- Google Chrome, Mozilla Firefox, or Safari web browser
Learning Styles Supported
- Visual
- Kinesthetic
Capstone Overview
The ITE 152 capstone project is based on data retrieved from My NASA Data.
Where does My NASA Data obtain its data from? “NASA commits to the full and open sharing of Earth science data obtained from NASA Earth-observing satellites, sub-orbital platforms, and field campaigns with all users as soon as such data become available.”
In this capstone project, you will be using the data from the My NASA Data website to create a spreadsheet, multimedia presentation, and a poster, newsletter, flyer, or brochure. These files will be created using Microsoft Excel, Microsoft PowerPoint, and Microsoft Word. The Capstone Project can be completed using a Windows, Macbook, or Chromebook computer. You will need a stable Internet connection to access the My NASA Data datasets and to upload your files to Canvas.
The completed capstone project files will be uploaded to Canvas Modules and presented in the class’s Zoom Live Lecture during the final week of class.
Capstone Objectives
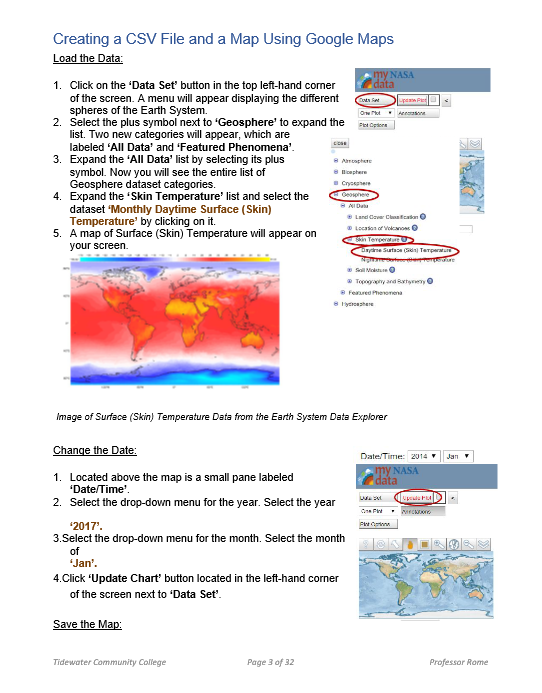
- Download the 2017 – 2021 Monthly Skin/Surface Temperatures datasets in CSV format from the My NASA Data Geosphere web page.
- Import the CSV file into Microsoft Excel
- Convert the data to a table
- Create a PivotTable, Slicer, and PivotChart for each year
- Create a Microsoft PowerPoint 10-slide presentation that discusses climate change using the data that was imported into Microsoft Excel and recent National and World News articles and videos
- Design a Climate Change brochure or poster using Microsoft Word
Capstone Content
Assessment
The following 7 files will need to be uploaded to the Canvas assignment link:
- Jan 2017 Map.png (up to 10 points)
- Dec 2021 Map.png (up to 10 points)
- 2017-2021 Monthly Daytime Surface Temperatures for TCC.csv (up to 10 points)
- 2017-2021 Monthly Daytime Surface Temperatures for TCC.xlsx (up to 100 points)
- Surface Temperatures and Climate Change.pptx (up to 100 points)
- Surface Temperatures and Climate Change PDF.pdf (up to 20 points)
- Climate Change Awareness.docx (up to 50 points)
This assignment can be completed using a Windows laptop, Chromebook, or MacBook.
Completion Time: Approximately 3 hours
Completion Value: Up to 300 points
Number of Students Impacted by this Capstone Project
Summer 2022 Semester
- ITE 152 – 12 students
- AST 236 – 24 students
Fall 2022 Semester
- ITE 152 (7-week) – 19 students
- ITE 152 (15-week) – 12 students
Capstone Project Presentation
Impact & What Was Learned
Impact:
The students learned how to acquire datasets from a website and then turned the raw data into useful information about climate change. They learned how to properly use Google Maps, Microsoft Excel, Microsoft PowerPoint, and Microsoft Word to create an educational learning tool.
What Was Learned:
The students learned what the effect of global warming has on the Earth’s climate. At the same time, the students sharpened their skills in building PivotTables, PivotCharts, Slicers, PowerPoint presentations, and Microsoft Word. They also learned how to do a presentation on Zoom.

